
Table of Contents
Have you ever wondered what the bounce rate metric is? If you’re not sure, don’t worry — you’re not alone.
The Google Analytics bounce rate is simply the percentage of visitors to a website who leave after viewing only one page, or a single page session. So, if 60 people visit a website and 30 of them leave after viewing the first page, the bounce rate would be 50%.
This metric is used to measure the effectiveness of keeping a website visitor interested. A high bounce rate indicates that a website does not have high user engagement, while a low bounce rate suggests that visitors are finding the content interesting and are staying on the site.
What’s a “Good” Bounce Rate?
There’s no denying that bounce rates are important. But what is a good bounce rate or a bad bounce rate, really? Is there such a thing?
Here’s the thing: bounce rates are relative. What matters is how your average bounce rate compares to your industry average. If you’re a brick-and-mortar store, your bounce rate will be higher than if you’re an ecommerce site. That’s because people who come to your store are likely just there to browse and don’t necessarily have an intention of buying something. Whereas someone who visits an ecommerce site is usually there for a specific purpose — to buy something.
So, when it comes to bounce rates, it’s not about having a “good” bounce rate or a “bad” bounce rate. It’s about understanding what your bounce rate means in the context of your business and making sure that it aligns with your goals.
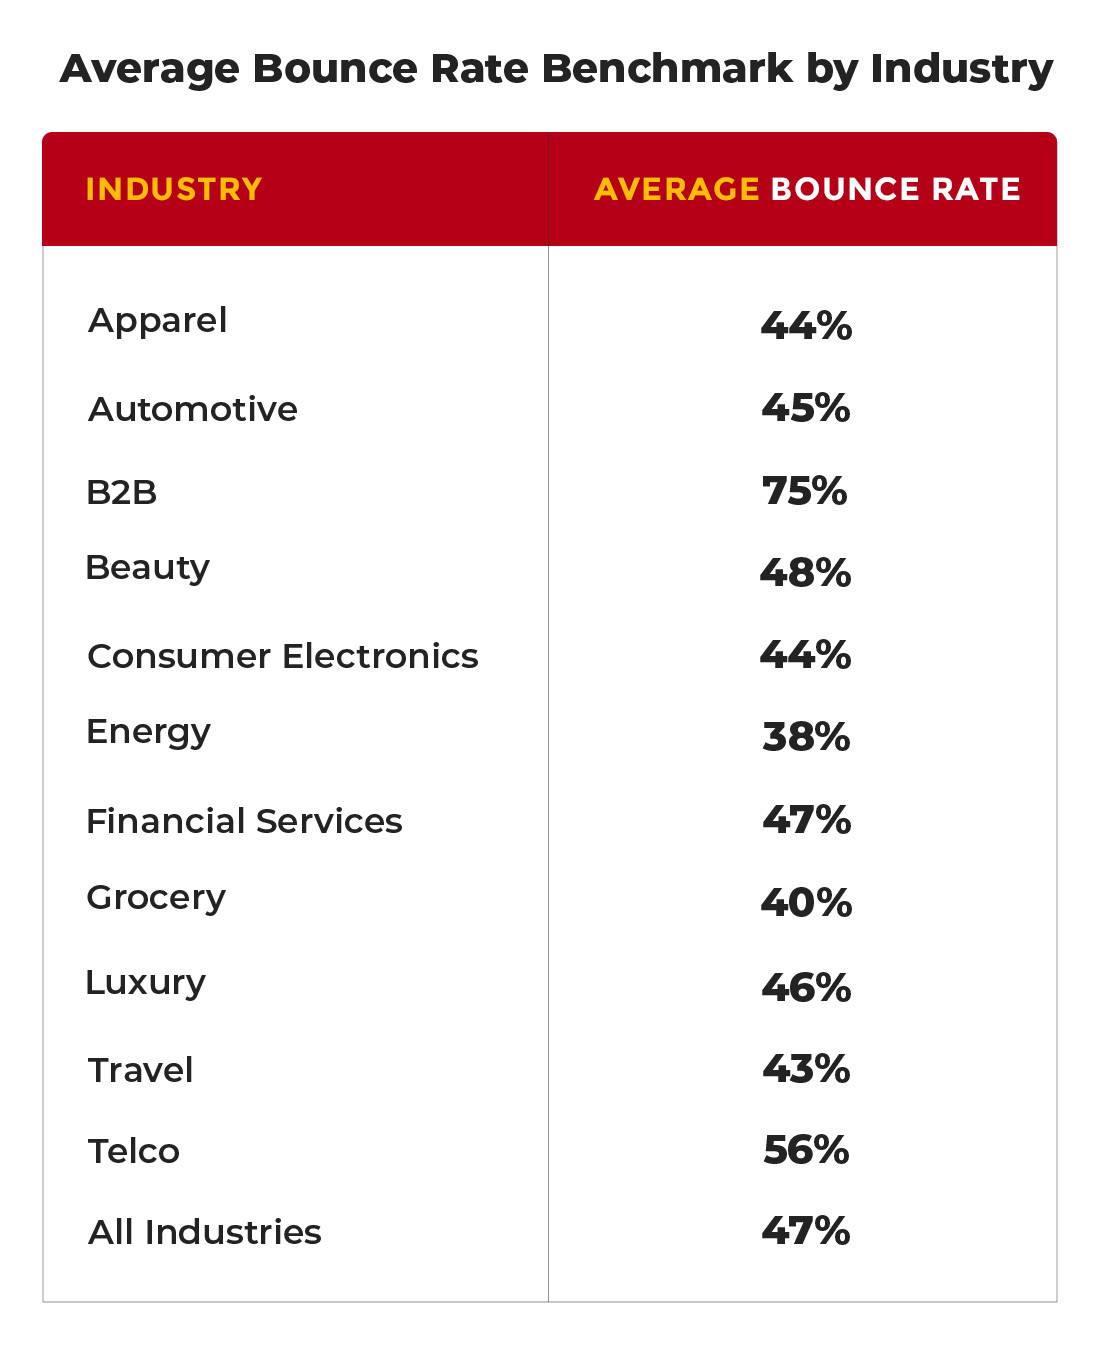
Ultimately, the best way to determine your bounce rate is to compare it to your own historical data and to benchmarks in your industry. By doing so, you can get a better sense of whether your current bounce rate aligns with your industry, or if there’s room for improvement.
Bounce Rate vs. Exit Rate
Two of the most commonly used Google Analytics metrics are bounce rate and exit rate. Both bounce rate and exit rate give insights into how visitors interact with a website, but they measure different things. And, neither is more important than the other.
As we stated previously, bounce rate is the percentage of visitors who bounce, or leave, after only viewing one page. By reducing bounce rate, you’re making an effort to create better content that will keep users on engaged and on your site and hopefully convert into a lead or customer.
Exit rate is the percentage of visitors who leave after viewing any number of pages. If you’re trying to reduce exit rate, then your focus is shifting to those who are engaged by your content, spending time on site, but are still leaving without completing their goal.
Both metrics can provide insight into visitor engagement and how they interact with your website. But for sake of this guide, we’re focusing on bounce rate — and how you can lower it.
How to Lower Your Bounce Rate
Unless your website is a single-page site, like a blog, where high bounce rates are normal you should assume that you want to lower bounce rates across all pages.
Here are some things that you can do and review to ensure that your content and website are performing to the best of their ability.
Technical Fixes
Before you start tearing apart all of your pages that are showing a high bounce rate, do a technical audit of your website. Site speed, slow load times, broken links, pop-ups, too many plugins, and other things that relate back to core web vitals are all relative to a positive user experience and search engine optimization.
These technical items on your site need to be in top working order before you even begin to adjust your content.
Choose Keywords Based on Intent
Not all keywords are created equal. And, no matter which you choose it will have an effect on your bounce rate based on its intent.
The intent tells you where the searcher falls in the sales funnel. If you choose a keyword and write a webpage intended for a transaction, but fail to recognize that the keyword is informational, your site visitors will not be pleased and leave your site.
You can use a tool, like Semrush, to determine the intent of your chosen keyword. And, based on the intent, you can better determine the angle and outline of your content to align with what searchers are looking for.
Cross-Reference Time Spent on Site
While it would be great if you could simply look at your overall bounce rate on its own and fully understand why users are leaving your site, that’s not the case. You need to take other metrics into consideration, like time spent on site. This will give you a better idea if there an issue site-wide or webpage to webpage since high bounce rate and low time spent on page go hand in hand.
And, the most obvious way to increase time on page is by publishing high-quality content that will not force your users to bounce.
Increase Readability
Here’s one thing you can count on, blocks upon blocks of text with small font, no imagery, and no headings can guarantee bounce rate.
Yes, you are the master of your craft, but you can’t forget about the user. After you’ve poured your heart and soul into your most recent blog post, take a step back. Does it more closely resemble a doctoral thesis or is it skimmable and easy to read?
Things you can do to change up your blog, article, or pillar page that will increase readability are:
- Add headings and subheadings.
- Provide visual interest with infographics, tables, and photos.
- Engage the reader with interactive elements like quizzes or calculators.
- Break up large chunks of text into smaller paragraphs.
- Incorporate more white space.
- Increase font size.
- Incorporate bullets when listings things out.
Make Your CTAs Very Clear
Each and every one of your calls-to-action should be very clear and easy to find. The last thing you want your visitors to navigate to your site ready to make a purchase and not be able to find where or how to do so.
Each organization has its own voice and branded terms. But CTAs are one place where internal jargon does not belong. Make it concise. Make it straight to the point.
Once you’ve determined the best language for your CTAs, you need to decide where to place them that won’t affect the user experience. Pop-ups can be effective but can also frustrate site visitors and increase your bounce rate.
Heat maps are a good tool to understand user behavior so you can be more strategic about where to place your CTAs. By seeing where the engagement is highest on page, you can test locations for your CTAs to determine the best spot for them.
Review Your Meta Title and Description
Metas. Yet another critical on-page SEO element that needs to be optimized. These are displayed in the Google search engine result pages for their respective webpages. It’s critical to ensure the title and description not only appropriately described the webpage, but that they grab the reader. Because this is the critical piece that will get the searcher to click on the result that leads them to your website.
No Silver Bullet for Low Bounce Rate
Generally speaking, you now know that a high bounce rate is not good news. It means that people are coming to your site and not finding what they’re looking for, or your site content is not engaging or worth reading. By checking in with your content and doing our recommended fixes you can get a lower bounce rate. And, while the above will help to decrease your bounce rate, there are several more factors that can contribute to a high bounce rate.
At RedShift, we know content marketing. And, we can partner with you to define your specific goals and determine a content strategy that will entice, attract, and convert your audience.